Denver sits on a complex mix of expansive Pierre Shale, wind-blown loess, and old alluvial terrace deposits from the South Platte River. With an average annual precipitation of just 14 inches and over 300 days of sunshine, the near-surface clays here cycle through extreme wet-dry seasons that can shrink and swell foundations by inches. Before you can size a drilled pier or design a post-tensioned slab, you need the liquid limit and plastic limit. That is where the Atterberg limits test comes in. The procedure follows ASTM D4318-17e1, using both the Casagrande cup method and the thread-rolling technique to determine the moisture contents where the soil transitions from brittle solid to plastic flow. We run these tests in our Denver lab on samples pulled directly from the B-horizon, typically at depths between 3 and 15 feet, where the highest clay activity is concentrated.
A plasticity index over 25 in Denver clays signals high swell potential that demands a geotechnical fix before the first footing is poured.
Methodology and scope
Local considerations
The lab setup is straightforward: a calibrated Casagrande cup with a flat grooving tool, a set of moisture cans, a balance readable to 0.01 g, and a glass plate for thread rolling. The risk sits in the sample itself. Denver-area clays can dry out fast in transit; if the moisture homogenization step is skipped, the liquid limit drops artificially, and the reported PI looks lower than reality. That can lead to an undersized foundation recommendation. We condition every sample for a minimum of 16 hours in a sealed container before the first drop count, exactly as the ASTM procedure requires. For highly plastic soils from the Denver Formation, we also check the one-point liquid limit correlation against a full four-point curve to verify that the slope matches the expected range. If a sample shows carbonate cementation or gypsum crystals — common in the lower Pierre Shale — we note it on the report because it affects both the plasticity and the long-term volume stability.
Applicable standards
ASTM D4318-17e1, ASTM D2487-17e1, AASHTO T-89/T-90
Associated technical services
Full Atterberg Limits Package
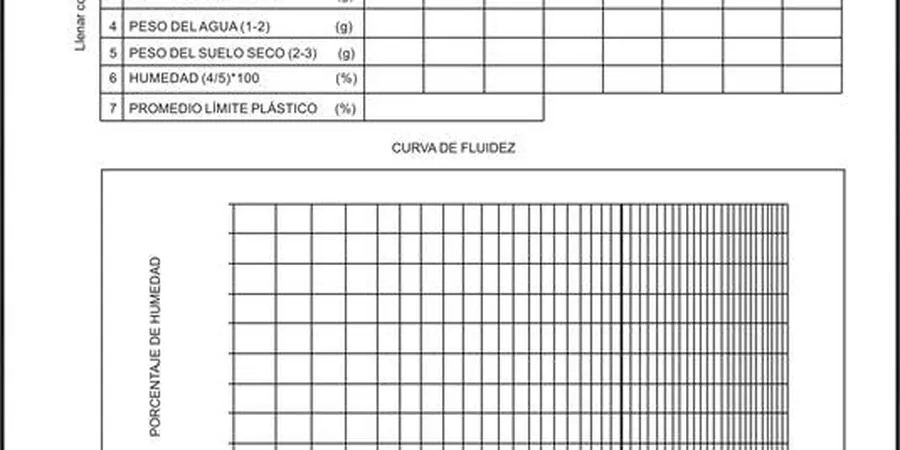
Multi-point liquid limit (4-5 points), plastic limit, and calculated plasticity index. Includes the flow curve plot and liquidity index when natural moisture content is supplied.
One-Point Liquid Limit
Statistical correlation method validated against a full curve for routine quality control on uniform Denver Basin clays. Faster turnaround when project schedules demand it.
Soil Classification Suite
Atterberg limits combined with sieve and hydrometer analysis to assign the full USCS group symbol and group name per ASTM D2487.
Typical parameters
Frequently asked questions
What do Atterberg limits actually tell me about my Denver site?
They quantify how your soil behaves with water. The liquid limit is the moisture content where the soil flows like a viscous liquid; the plastic limit is where it crumbles when rolled. The difference — the plasticity index — tells you how much water the soil can absorb while staying plastic. In Denver, a high PI above 25 almost always means expansive clay that will heave and shrink with seasonal moisture changes. That directly drives foundation type: drilled piers, structural slabs, or moisture-conditioned subgrades.
How much does Atterberg limits testing cost in Denver?
For a full multi-point liquid limit plus plastic limit, expect to pay between US$60 and US$110 per sample. The range depends on whether we run a one-point or full curve, the number of samples in the batch, and how quickly you need the results. A one-point liquid limit alone falls at the lower end of that range.
How long does the test take from sample drop-off to report?
Standard turnaround is 3 to 5 business days. The drying and conditioning step alone takes 16 to 24 hours per ASTM D4318. If you need results faster, we can run a one-point method on a rush basis — call us before you drop off the samples and we will confirm the schedule.
Do I need Atterberg limits if I already have a grain-size analysis?
Yes. Grain-size tells you the particle distribution; Atterberg limits tell you how the fine fraction behaves with water. Two soils can have the same percent passing the #200 sieve but completely different plasticity. A silty sand and a fat clay look identical in a sieve stack, but their foundation requirements are worlds apart. More info.